When ETCD Crashes, Check Your Disks First: A Pod CrashLoopBack Debugging Story
Setting up a cloud-edge continuum testbed for a computer vision demo taught us
something fundamental about distributed systems: etcd doesn’t forgive slow
storage.
The Demo Setup
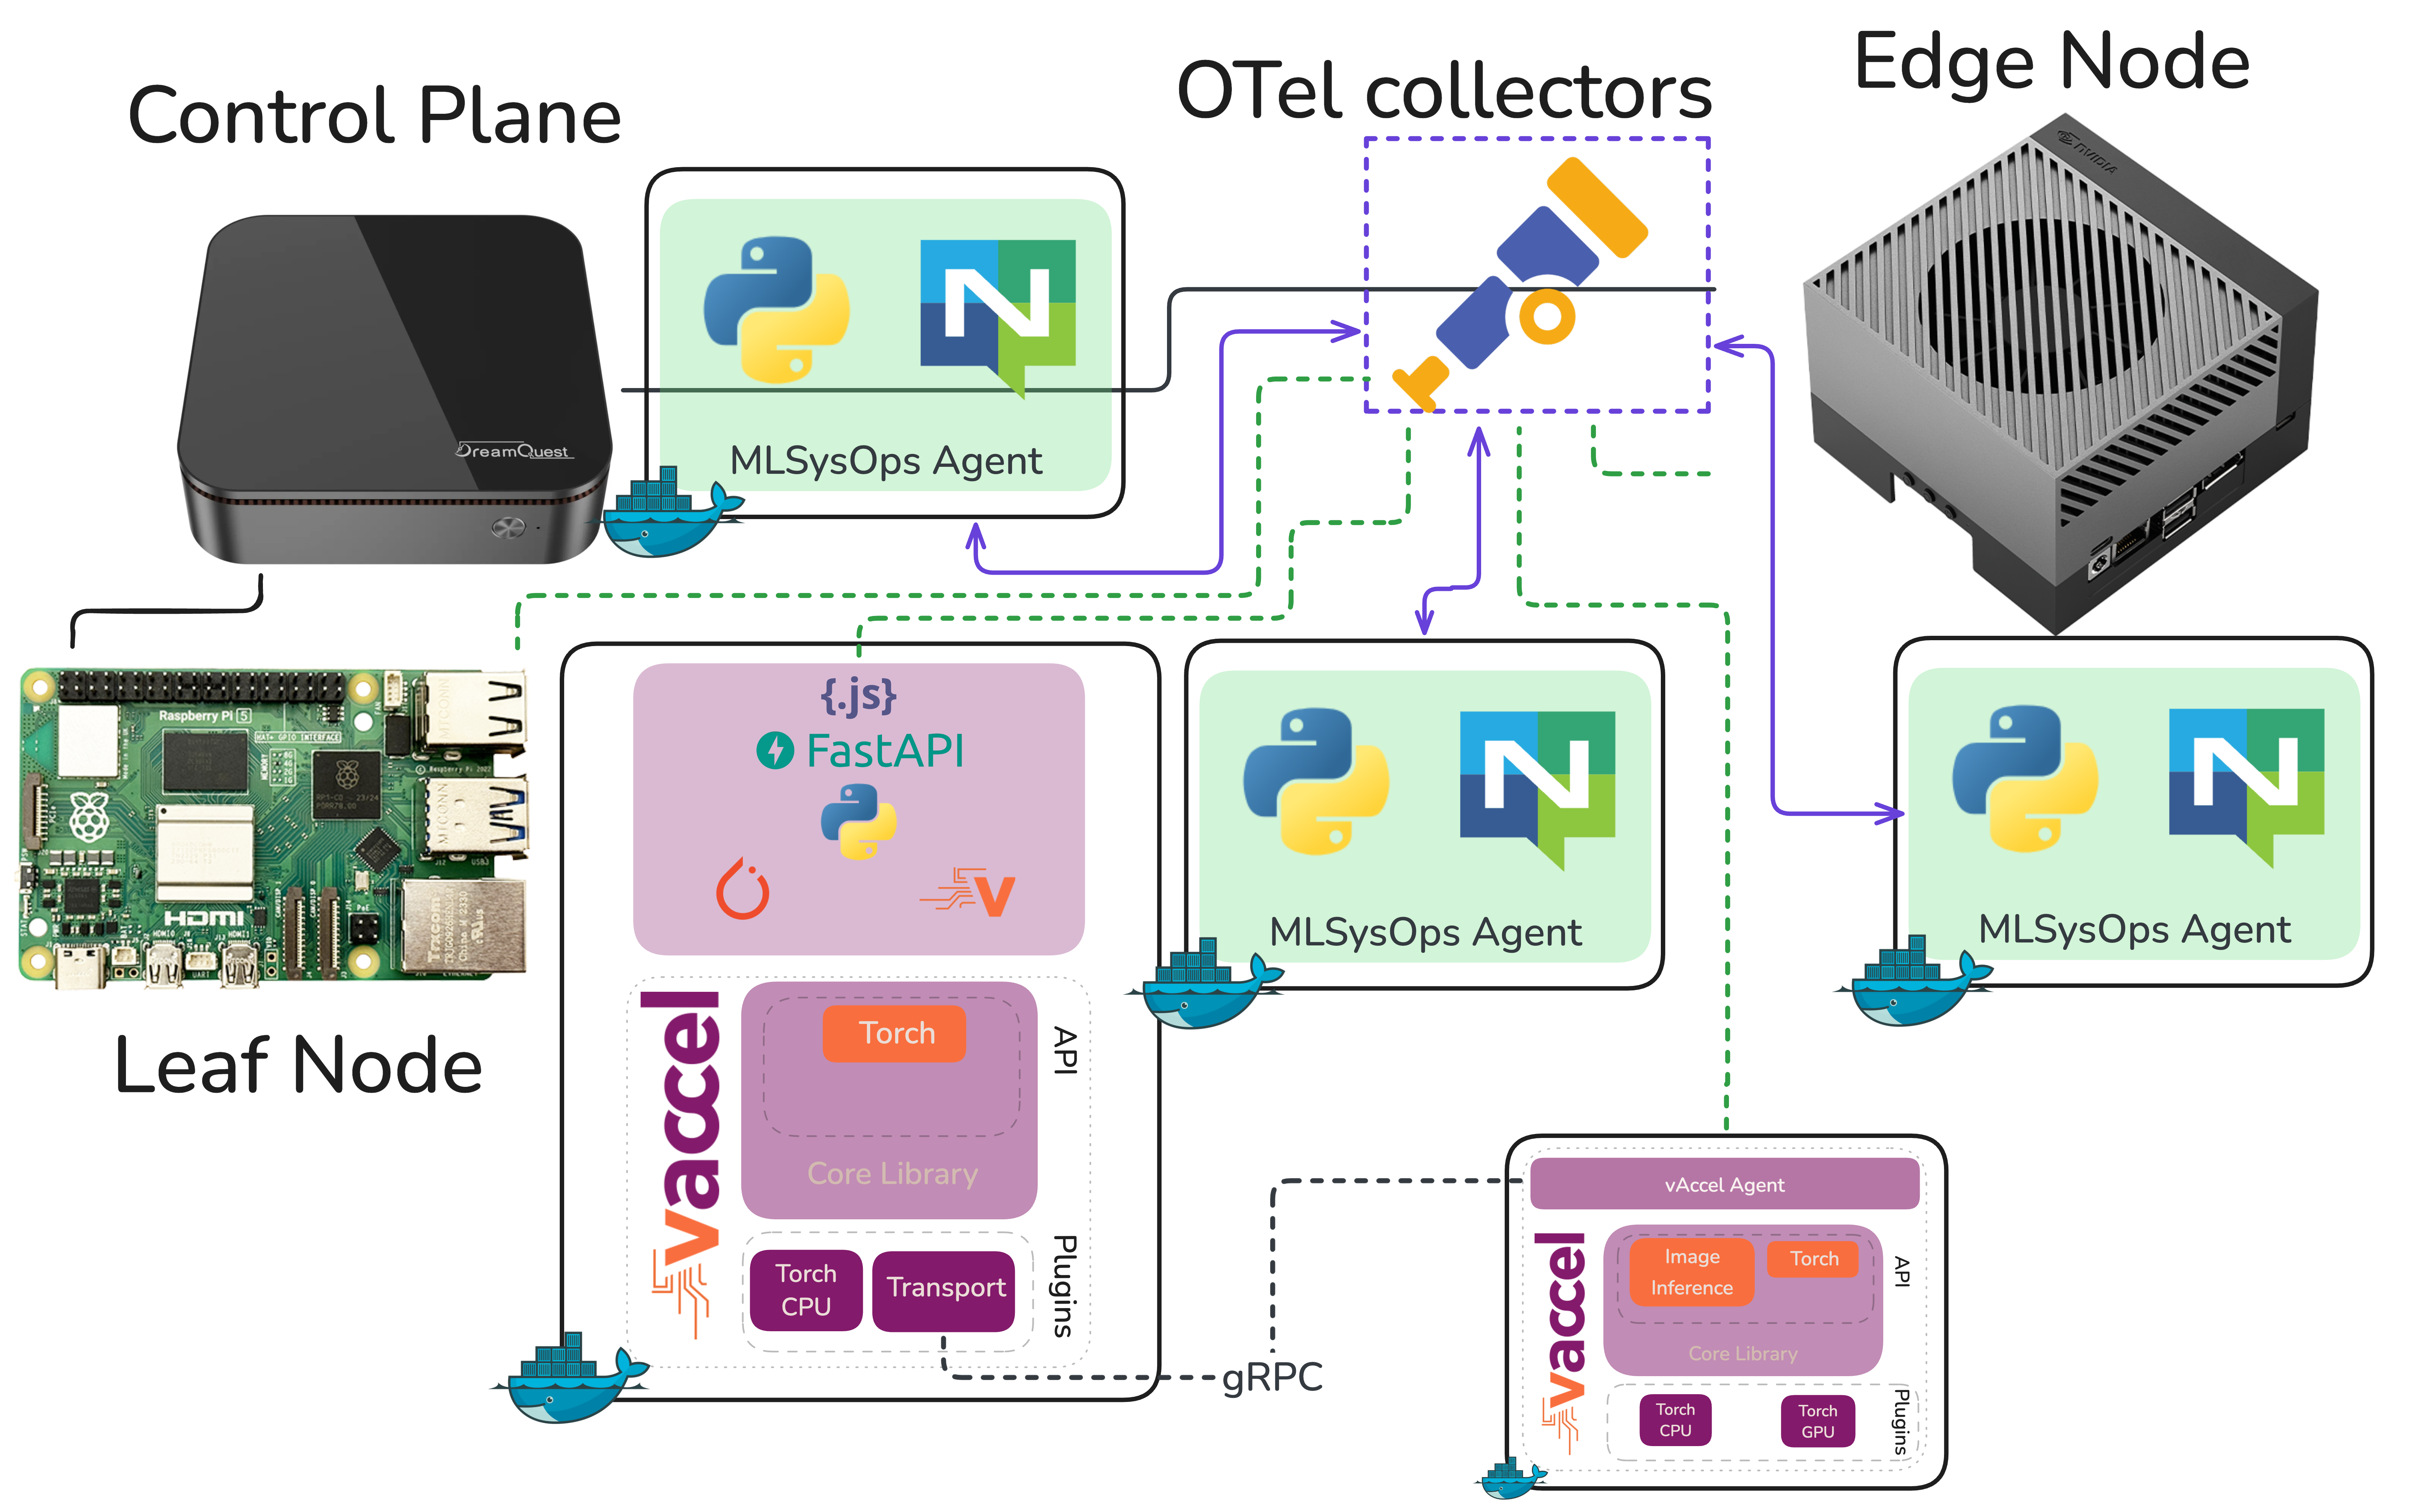
We’ve been building a demonstration for MLSysOps — a framework that enables custom policies (simple or ML-based) to customize the deployment and runtime behavior of applications across the Cloud-Edge-IoT continuum. The idea is to show how telemetry-driven policies can dynamically adapt where and how an application runs, without the developer or operator having to intervene manually.
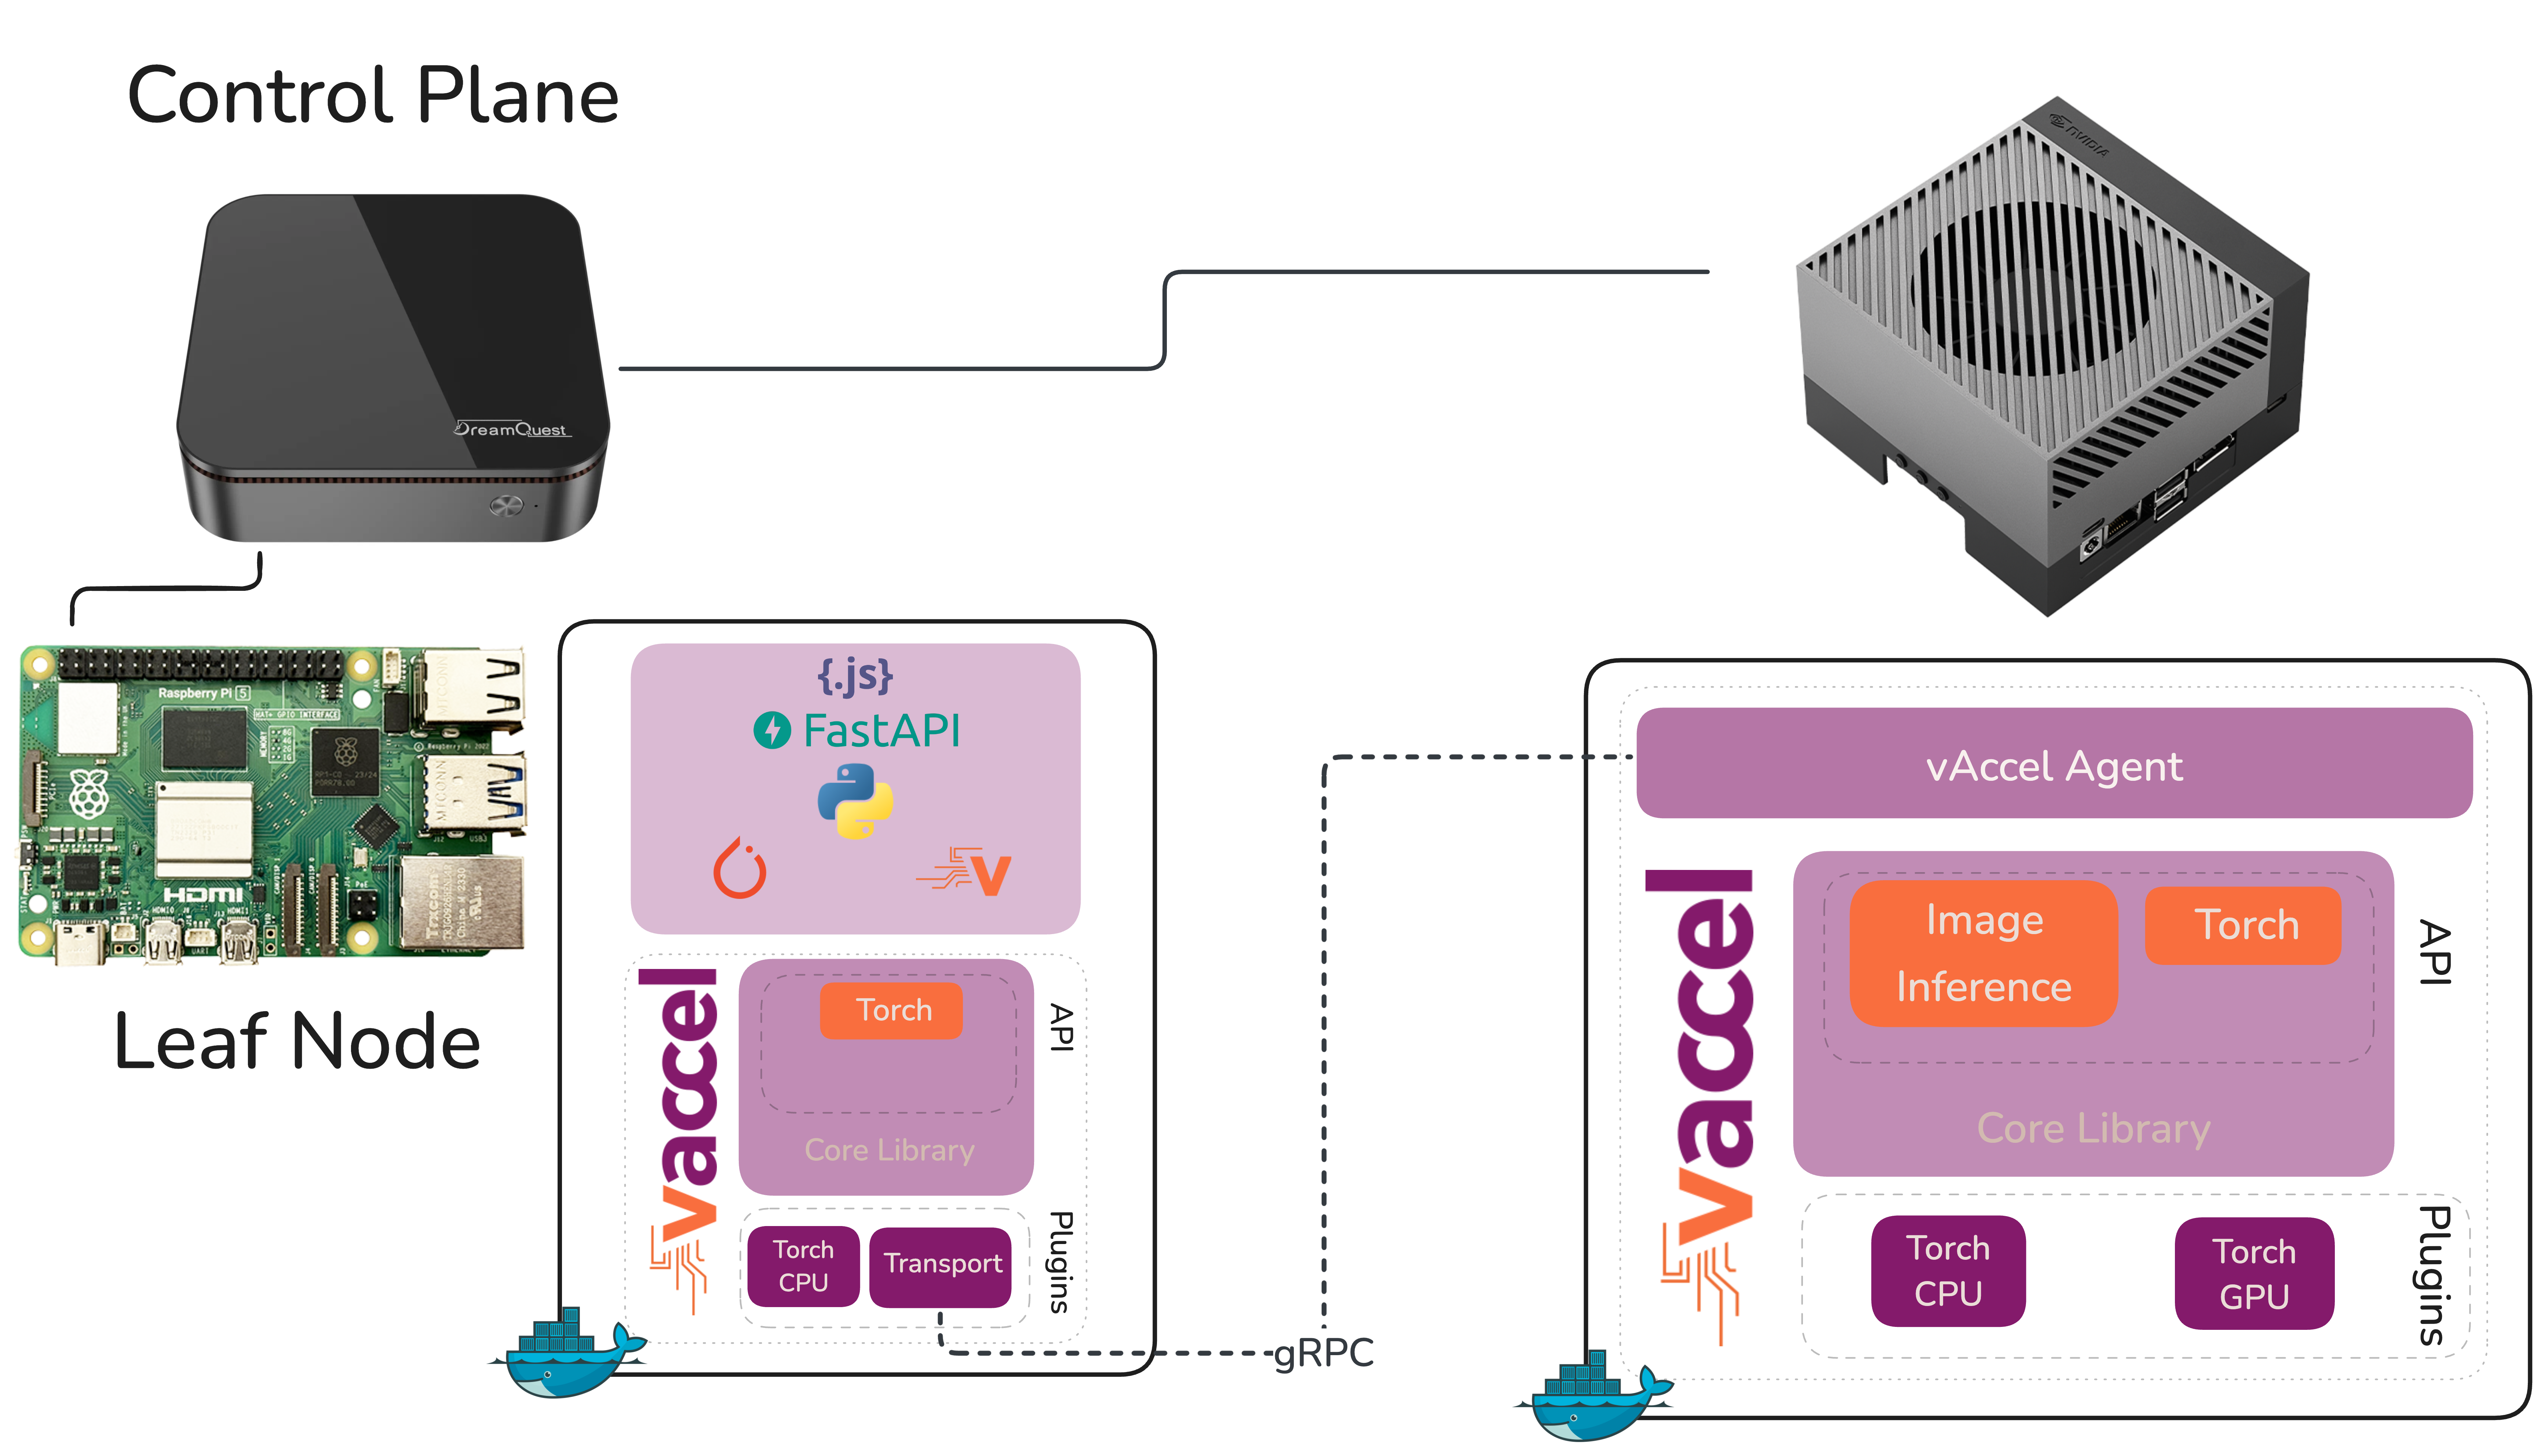
The demo stack is straightforward: Karmada as the continuum orchestrator sitting on top of individual k3s clusters. The application is a computer vision pipeline doing real-time object detection. The hardware? A NUC, a Raspberry Pi, and a Jetson AGX Orin. More info on setting up the testbed can be found in the MLSysOps github repository
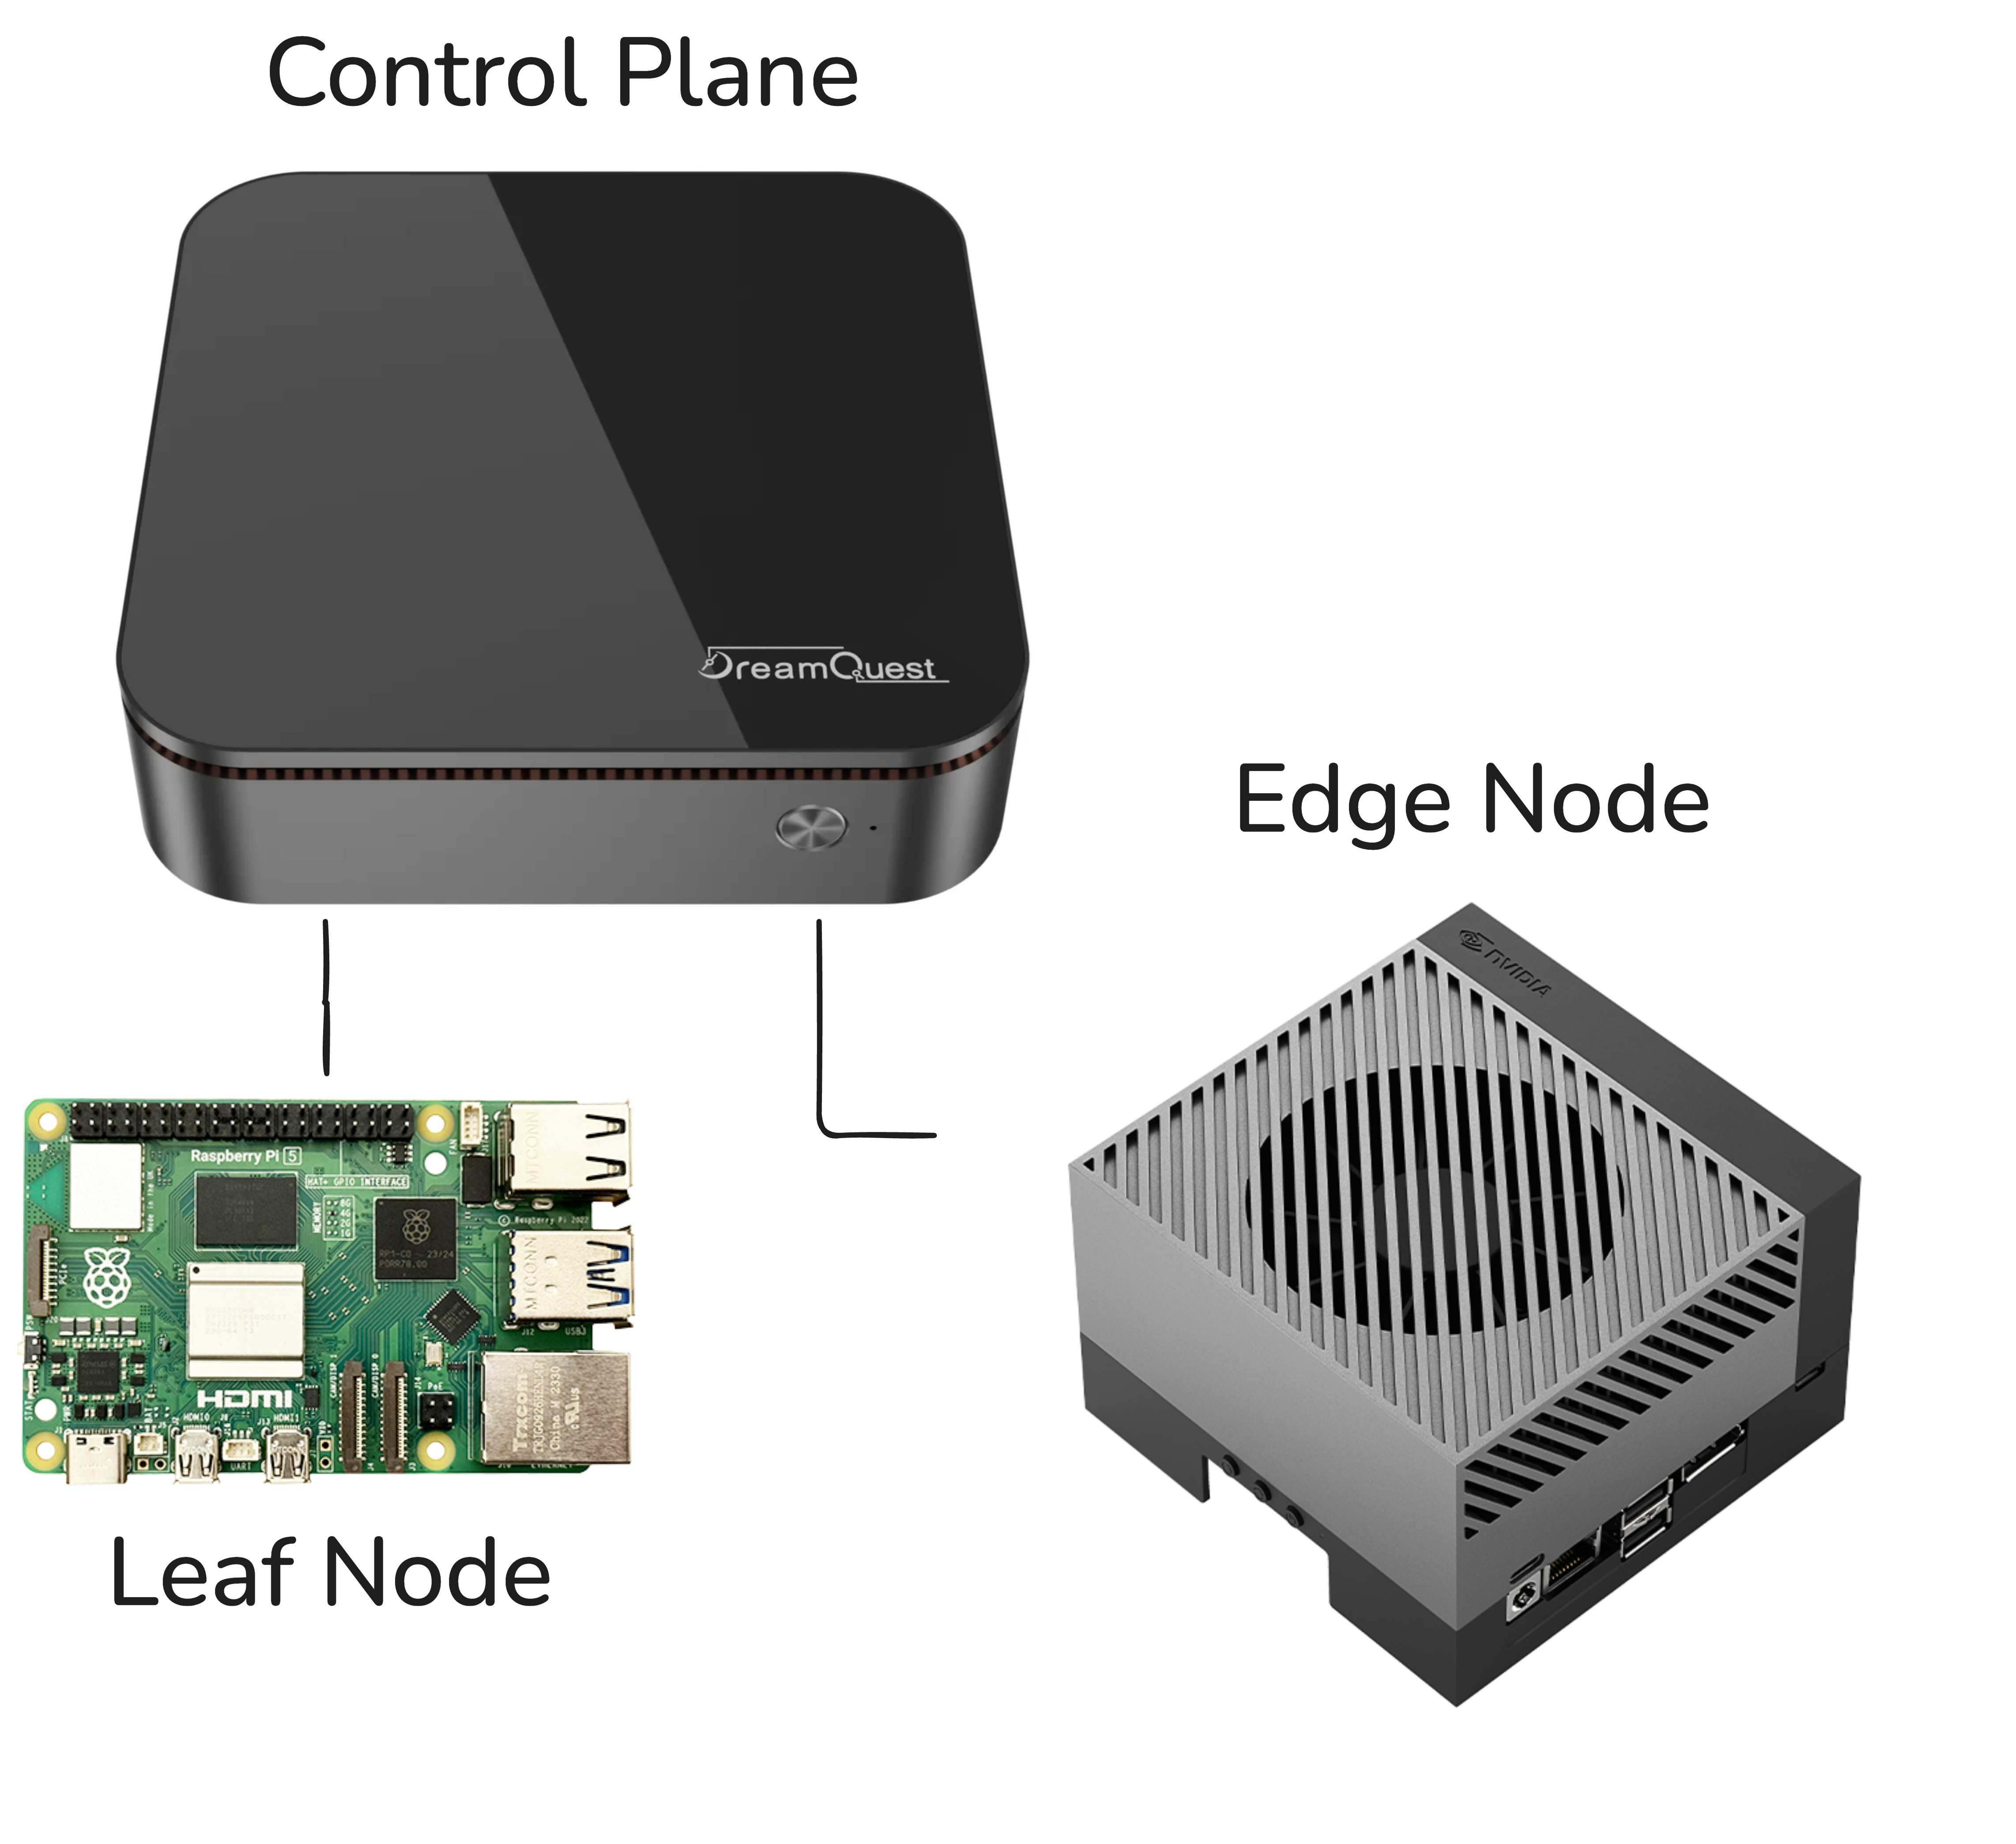
The demo flow goes like this: the object detection workload deploys and runs locally on the Raspberry Pi. As the Pi starts to struggle, frame rate drops, inference latency climbs, the MLSysOps agents picks this up through telemetry and transparently switches the vAccel backend to point at the Jetson AGX Orin. Suddenly the workload is offloaded to serious GPU hardware, real-time object detection kicks-in, and the policy change is the only thing that made it happen. No redeployment, no manual intervention. That’s the story we want to tell.
But before we could tell that story, we had to actually get the cluster running. And that turned out to be more interesting than expected.
A Four-Node Cluster on Three Physical Machines
Here’s the constraint we were working with. Karmada uses etcd to persist its
own state, separate from the etcd instances backing individual Kubernetes
clusters. In k3s this is embedded in the k3s binary (no need to manually handle
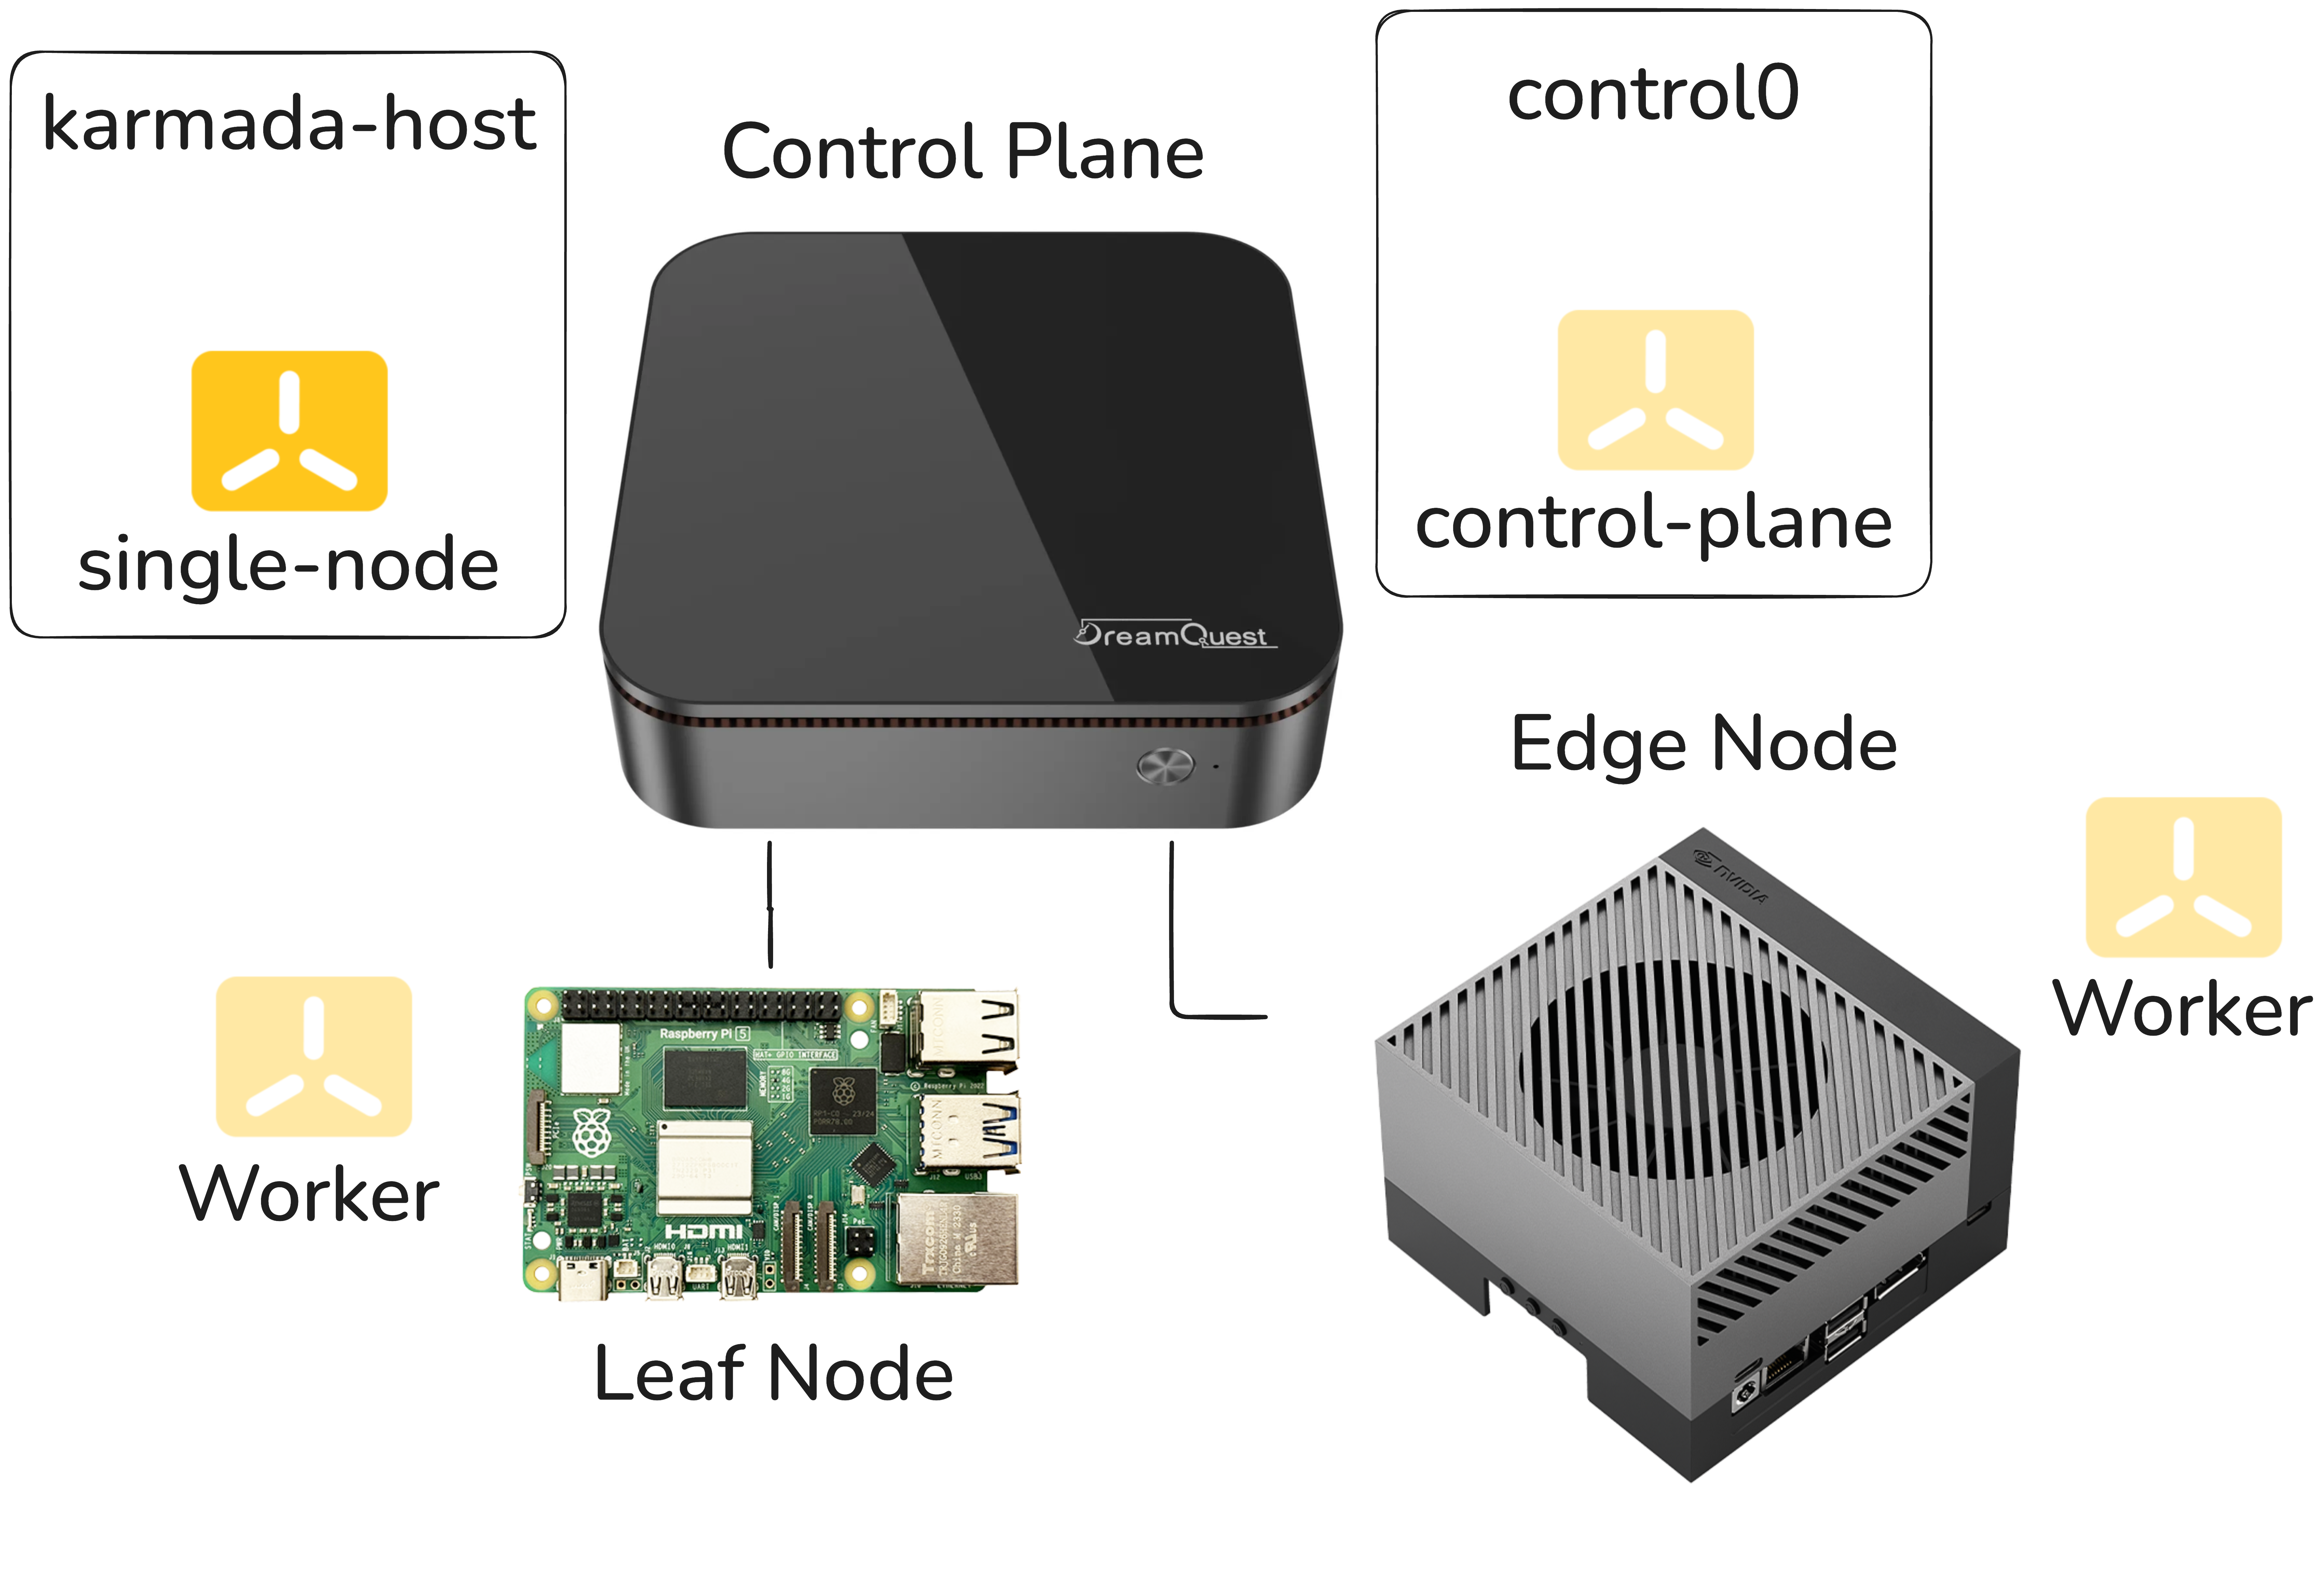
etcd instances). This means the Karmada host effectively needs to be its own
node, distinct from the clusters it’s orchestrating. With only three physical
machines and a desire to keep the demo self-contained, we spun up two VMs on
the NUC: one to act as the Karmada host and one to serve as the control plane
for the k3s cluster, with the Raspberry Pi and the Jetson as worker nodes.
Logical, pragmatic, and as it turned out, the source of a very subtle problem.
The Symptom: Pods That Wouldn’t Stay Up
After getting Karmada installed, we started noticing that Karmada’s own pods were crashing every five to ten minutes. Regularly. Predictably. Maddening.
The crashes weren’t immediately informative. The pods would come back up, run for a while, and crash again. Nothing in the application layer seemed wrong. The k3s clusters themselves looked healthy. We went through the usual suspects, resource limits, networking, configuration drift between restarts, and came up empty.
The investigation got genuinely pedantic. We started pulling on every thread we could find in the logs, correlating timestamps, looking for patterns in what was dying and when.
The Root Cause: etcd and I/O Latency
Eventually the logs pointed somewhere unexpected: etcd was timing out. Not
crashing due to a bug or misconfiguration in the Karmada setup itself, but
because the underlying storage wasn’t responding fast enough for etcd’s
expectations.
etcd is a strongly consistent, distributed key-value store, and that
consistency comes at a cost: it is extraordinarily sensitive to I/O latency.
etcd uses a write-ahead log and relies on fsync calls completing within tight
time windows. When storage is slow, even intermittently, etcd starts missing
its internal heartbeat and election deadlines. Leader elections fail. The
cluster loses quorum. Pods that depend on the API server start dying.
The VMs on the NUC were sharing the host’s storage, and under the default
configuration, the I/O performance wasn’t consistent enough to keep etcd
happy. Bumping the etcd timeout thresholds helped a little but didn’t solve
the problem, it just moved the failure threshold slightly. The root issue was
the storage itself.
The fix came from a different direction: ZFS tuning on the nuc. After
optimizing the ZFS storage backend, adjusting settings that affect how
aggressively writes are committed and how I/O is scheduled, the latency
profile improved enough that etcd stopped timing out. The pod crashes
stopped. The cluster became stable. FWIW, we used the following:
zfs set sync=disabled default # Disable sync writes
zfs set compression=lz4 default # use LZ4 compression
zfs set atime=off default # No atime
zfs set recordsize=8k default  # Better for small etcd writes
sync=disabled: Normally ZFS waits for data to be physically written to disk before confirming a write operation to the application (synchronous writes). Disabling sync means ZFS acknowledges writes immediately without waiting, which dramatically reduces write latency. This is why etcd stopped timing out: fsync calls returned instantly instead of blocking. The tradeoff is that in a power loss scenario, the last few seconds of writes could be lost. For a demo VM, that’s an acceptable risk; for production etcd storing critical state, you’d think harder about it.compression=lz4: Enables transparent compression on all data using thelz4algorithm.lz4is specifically chosen here because it’s extremely fast: fast enough that the CPU overhead of compressing/decompressing is usually outweighed by the reduction in I/O, since you’re reading and writing less data to disk. For a VM image with lots of repetitive data (filesystem metadata, logs, Kubernetes objects), this typically gives decent compression ratios with negligible performance cost.atime=off: By default, filesystems record the last access time on every file every time it’s read. This turns every read into a write, which doubles I/O pressure for read-heavy workloads. Disabling atime means reads are just reads. Almost every performance-tuned Linux system does this.recordsize=8k: ZFS uses a configurable record size (default 128K) when writing data. etcd’s underlying storage engine (bbolt) works with small, random reads and writes. Setting recordsize to 8K aligns ZFS’s I/O unit closer to what etcd actually does, reducing write amplification — instead of reading and rewriting a 128K block to change a few bytes, ZFS only touches an 8K block.
Taken together these four settings basically tell ZFS: stop being cautious, be
fast. The sync=disabled setting is the one that almost certainly stopped the
etcd crashes on its own, the other three are good housekeeping that reduce
overall I/O pressure and keep things humming. In a production setting you’d
want to be more careful, particularly with sync=disabled, but for a demo
environment running on shared VM storage it’s a very pragmatic solution.
The Lesson: When etcd Crashes, Look at Your Disks
This is the pattern worth internalizing. If you’re running Karmada (or any
Kubernetes-adjacent system that embeds etcd) and you’re seeing periodic pod
crashes that don’t have an obvious application-level cause, the first question
to ask is: how is the storage performing under etcd’s workload?
The etcd documentation actually calls this out: it recommends SSDs and warns
against running etcd on storage that’s shared with other I/O-heavy workloads.
In a production cluster you’d typically have dedicated storage for etcd
nodes. In a demo environment running VMs on shared hardware, that’s easy to
overlook.
A few diagnostics worth running if you suspect this problem: etcd exposes
metrics via Prometheus. The ones to watch are
etcd_disk_wal_fsync_duration_seconds and
etcd_disk_backend_commit_duration_seconds. If the 99th percentile on either
of these is consistently above 100ms, you have a storage problem, not a
configuration problem.
You can also run a quick benchmark against the storage path etcd uses with a
tool like fio to get a baseline read/write latency profile before you ever
install etcd on a machine.
Back to the Demo
Once the cluster was stable, the actual demo came together quickly. The MLSysOps policy layer does what it’s supposed to do, telemetry comes in showing the Raspberry Pi falling behind on frame rate, the policy fires, the vAccel backend switches to the Jetson AGX Orin, and object detection snaps to real time. The network hop is there but the GPU makes it irrelevant. It’s a compelling demonstration of what adaptive policy-driven orchestration can do in a heterogeneous edge environment. We just had to fight through a disk I/O problem to get there.
Sometimes the most useful debugging sessions are the ones where the answer
turns out to be completely orthogonal to where you were looking. etcd taught
us that distributed systems have strong opinions about their infrastructure.
It’s worth listening to them.
Checkout our demo: